
|
BPVM 1.0
Budapest vectorial map and database system for GIS modelling 
General information
A complete map and a database system were produced to give a geographical
reference system for examining natural, social, economic processes in time
and space.
A lot of environmental problems can be approached in a much easier manner by help of GIS. However, having a map and a proper database system regarding the area to be analysed is of major importance. Our vectorial map and database system were created to meet different requirements, such as:
Software
The vectorial map of Budapest was made in MapInfo, and stored in the
format of MapInfo (*.tab). This format, however, can be converted to the
most common file formats in GIS, i.e., ArcView *.shp, AutoCad *.dxf or
MicroStation *.dgn formats, as well.
The database tables were created partly in the own database system of MapInfo, and partly in MS Access. Access allows using its tables without any conversion into MapInfo, though, exclusively non-graphical data are available in Access (e.g. the data on the population in each district). Projection, theoretical scale
The whole map was created in EOV (Unified National Projection) projection.
The density of data on the vectorial map is equal to the details of a 1:30000
paper map.
Map files
The map was created to represent the whole area of Budapest and the
neighbouring settlements. However, in case only some quarters are of importance
from the point of view of research, several additional tasks to be done
occur. Therefore, depending on demands, possibility for creating maps of
one or more districts is provided for users. All the 23 districts in Budapest,
furthermore, the villages and towns surrounding the capital are indicated
with an identification (ID) number of their own. Users may select all the
graphical objets in a district by using the ID number, and make a map of
one or more districts in a moment.
List of the completed map files
Database system
The aim of the following database systems is to give a reference system
for examining natural, social and economic processes. These tables contain
different data of the districts in Budapest, furthermore, of the neighbouring
towns, villages, and they cover a long period (1985-2002). The eight large
groups of the accomplished tables are as follows:
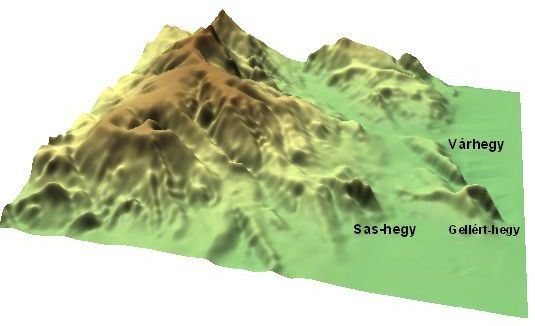
Digital Elevation Models
We created digital surface models, based on the contour lines of topographic
maps. The surface model can be used in MapInfo or in other programs as
well (e.g. Surfer), and is useful in projects of environmental issues,
in course of which height is a major attribute. Our surface model may be
combined with any kind of thematic maps (e.g. a transparent map of CO2
concentration), and ordinary topographic layers (roads, lakes, forests
etc).
Monitoring
In course of comparing the environment with any kind of thematic data,
a wide range of tasks is to be solved. Sometimes only one date, sometimes
a period is in the focus of research.
Examining the environment in one specific time, in one specific area, could raise difficulties, since there are not enough data measured to create a precise and reliable thematic map on the concentration of a certain substance (e.g. hydrochlorid acid). Consequently, modelling programs which consider the concentration in all the areas of interest to be tested are used. The modelling program creates a grid model (the distance between the nodes may be modified) and MapInfo creates a thematic map, based on the above grid model. Each node of the grid model contains three data: coordinates X and Y (in EOV projection), and the order of magnitude of concentration in the reference time. The completed thematic map covers the base map up because colour areas represent different concentrations. Thus, the transparency of the thematic map is set, and the environment (base map) can be compared with the thematic map. In case monitoring an area, this technology should be used, though, numerous thematic maps must be created, covering a lot of references of time and different kind of substances. The grid files have tables of their own, and in monitoring tasks tables of differences can be composed from two tables. Then, a thematic map of the table of difference can be made. The map in question shows the changes in the concentration of a substance, between two reference periods. If one is interested in even more substances, intending, simultaneously, to represent those in the same map, and to compare the same with the environment (base map), then one needs to create charts and diagrams. The concentration of one substance can be analysed by help of a transparent thematic map, and numerous charts can be created in any point or points of the map. (These are the nodes of the grid file.) The above charts will show the concentration of another substance. On the thematic maps colours represent the order of magnitude of the concentration, while the same is expressed by the height in the charts. Furthermore, diagrams can be created independently of maps (to be inserted, e.g., into publications). Optional points (e.g. cross-roads, squares) on the map can be selected, and MapInfo makes different kind of diagrams from the data of one or more substances, concerning the reference time or a period of time. |
